3.5" Form Factor

PC/104

PC/104-Plus

PCIe/104

PCI/104-Express

COM Express

Single Board Computers

I/O Modules

Power Supplies

Single Board Computers

I/O Modules

Power Supplies

I/O Modules

Single Board Computers

Cables

PC/104

Adapters

PC/104

PC/104-Plus

PCIe MiniCard

PC/104

PCIe MiniCard

PC/104

PC/104-Plus

PCI/104-Express

PCIe MiniCard

PC/104-Plus

PCIe MiniCard

PC/104-Plus

PCIe MiniCard

I/O Modules

Single Board Computers

I/O Modules

PC/104

PC/104-Plus

PC/104

Small form factor

Ethernet Switch Modules

Single Board Computers

Ethernet Switches

AGX Orin Solutions

ORIN Nano / NX

Nano and NX Solutions

AGX Xavier Module Solutions

TX2 / TX2i Module Solutions

Whitepapers

Designing Embedded Computers for Rugged Applications

Application Articles

Building Automation
Paper Processing
Train Controller
Wind Instrument
Lung Simulator
Gas Analyzer
Weapon System

Visit our Markets & Applications page.

Sign Up for our eNewsletter Today!


A/D Board Tutorial
Slideshow Contents
Introduction
Typical A/D Board Architecture
A/D Chip Technology
Resolution and Input Range
Input Bandwidth
Input Channel Configurations
Differential Input Simulation
A/D Sampling Methods
A/D Triggers
Sampling Sequences
Data Transfer to Memory
Interrupt Timing
Source Impedance
Source Impedance - Solution
Calibration
Autocalibration
Comparison Test: Autocalibration vs. Manual Calibration
Results: Autocalibration vs. Manual Calibration
<-prev next->

Comparison Test: Autocalibration vs. Manual Calibration


A test was conducted to compare the performance of an autocalibrating A/D board vs. a manually calibrated board. A Diamond Systems DMM-32-AT autocalibrating A/D board and a competitor's manually-calibrated A/D board were selected for the test. Both boards are advertised by their manufacturer as operating over the temperature range of -40 to +85 degrees C.

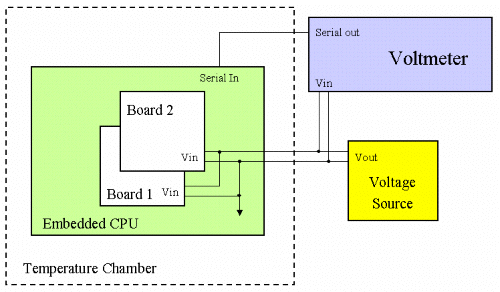
The two boards were installed on an embedded CPU, and the assembly was placed in a temperature chamber. Outside the chamber was a precision voltage source and a precision voltmeter with serial port output. The voltage source was connected to both A/D boards and the voltmeter. The CPU was connected to the voltmeter's serial port.

As the temperature swept through the test range of -40 to +85 degrees C at 5 degree increments, the test program read the A/D values from both boards and compared them to the meter reading (via the serial port). At each test temperature, multiple readings were taken and averaged to eliminate noise. Every 5 degrees, the autocalibrating board was recalibrated via its software driver.

The errors were logged and graphed. (See next slide.)